This is a sample of an Annual Benchmark Report on a hypothetical strata community, Octopus Villas. We have broken it down and will review each section to clarify what is displayed and why it could be useful.
Introduction
The Annual Benchmark report is entirely data-driven, with the only discretion being the parameters that determine the composition of the comparison group. Eli Report has served approximately 6,000 unique strata communities since launch, and each contains benchmarks to other stratas of a similar type and age. There are often hundreds, and a mimium of 60 built within several years, but for the Annual Benchmark Report comparison group we tighten the parameters. The comparison group should generally be 10-50 stratas that are closer in size (units / storeys), replacement value, and occassionally region.
Scorecard
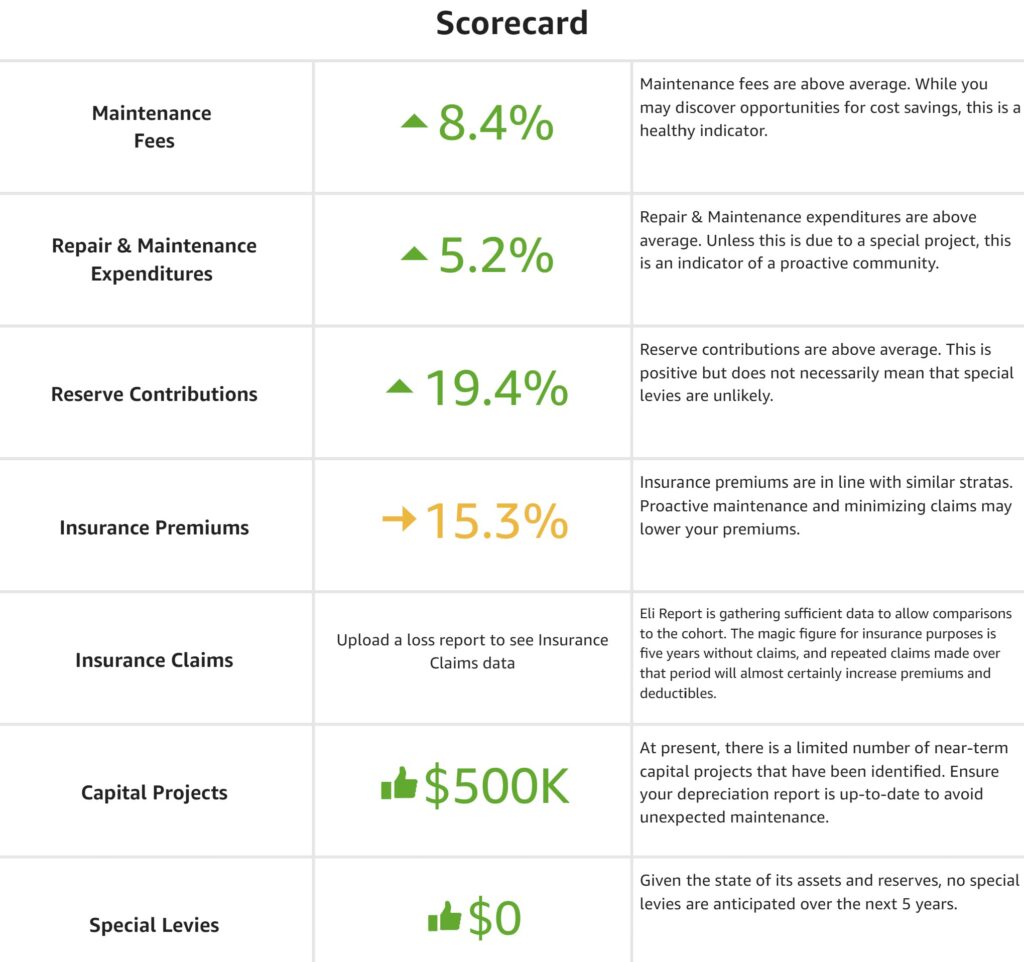
The Scorecard is a quick reference of how your strata is doing relative to the comparison group across a set of key performance indicators. While each strata is unique, knowing whether yours is paying or spending more or less than similar communities sets the scene. With easy to understand traffic-light indicators, and brief explanations of why, your strata can set its sights on how to imrpove and monitor that performance year-over year.
Overview
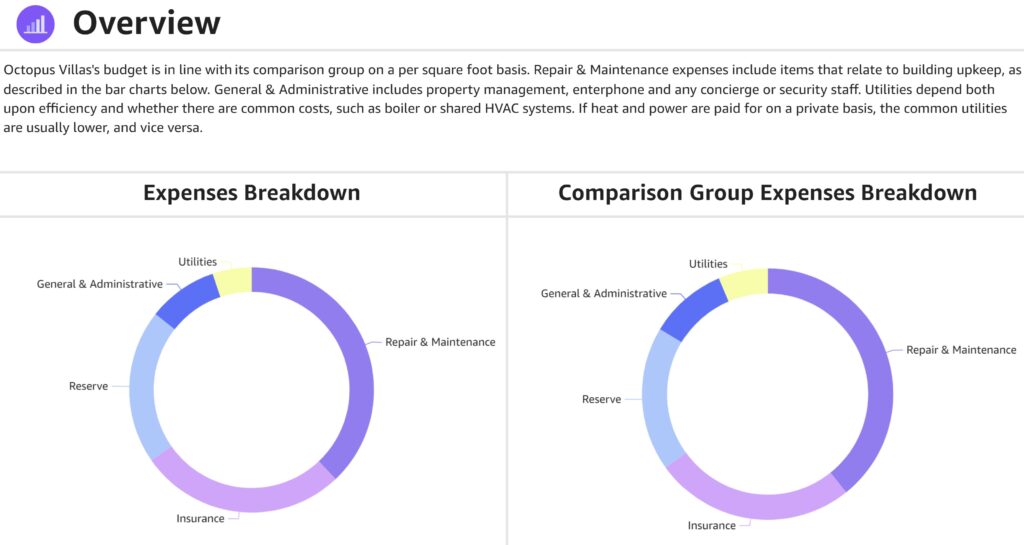
To commence your review of expenses, we start at the highest level, looking at the category breakdown across Repair & Maintenance, Insurance, Reserve Funding, Utilities and General & Administrative. A brief explanation of what is included in each at the top is fully explained on the following page. Identify significant disparities, and prepare for a deeper look.
Repair & Maintenance Breakdown
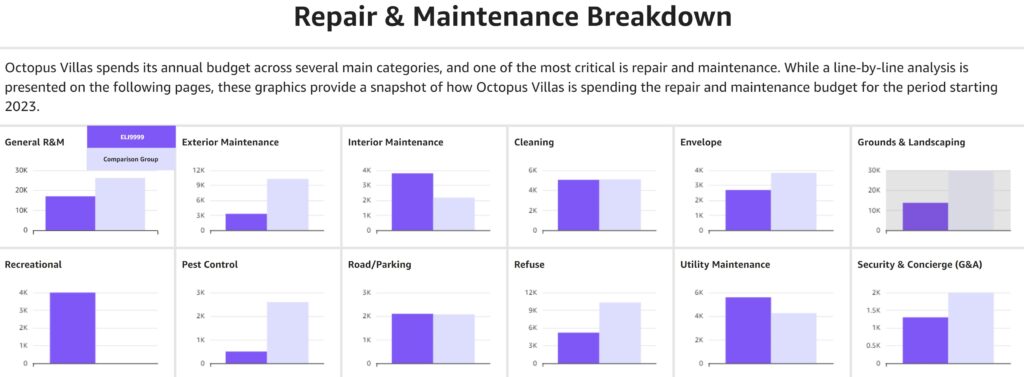
This breakdown allows you to see your strata’s total dollar expenditures relative to the comparison group’s across repair and maintenance sub-categories. For visual impact, the scale of each sub-category is different. Be aware that on this analysis, there is no adjustment for the number of units so you will likely be comparing to some communities that are larger and smaller than yours based on the comparison group described in the Introduction section.
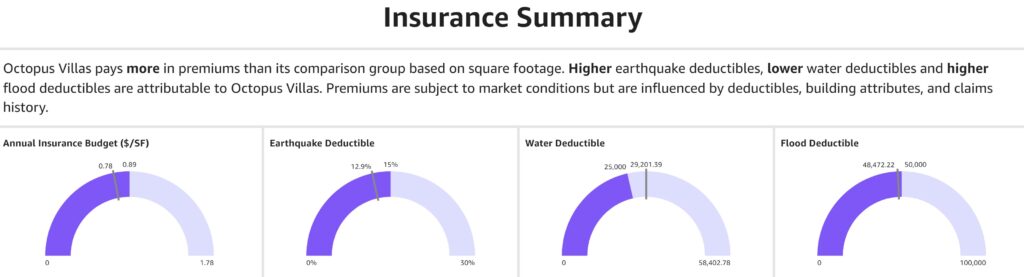
Insurance Summary
As one of the largest line items in most strata budgets is the insurance premium, we show what yours is realtive to the comparison group. We also show the level of several key commerical property deductibles: earthquake (in BC, these used to be 10% or less, now are trending towards 15-20%), water & flood. Your strata is the dark purple, and the line represents the comparison group average. Being lower, as shown in the water deductible example below, is better:
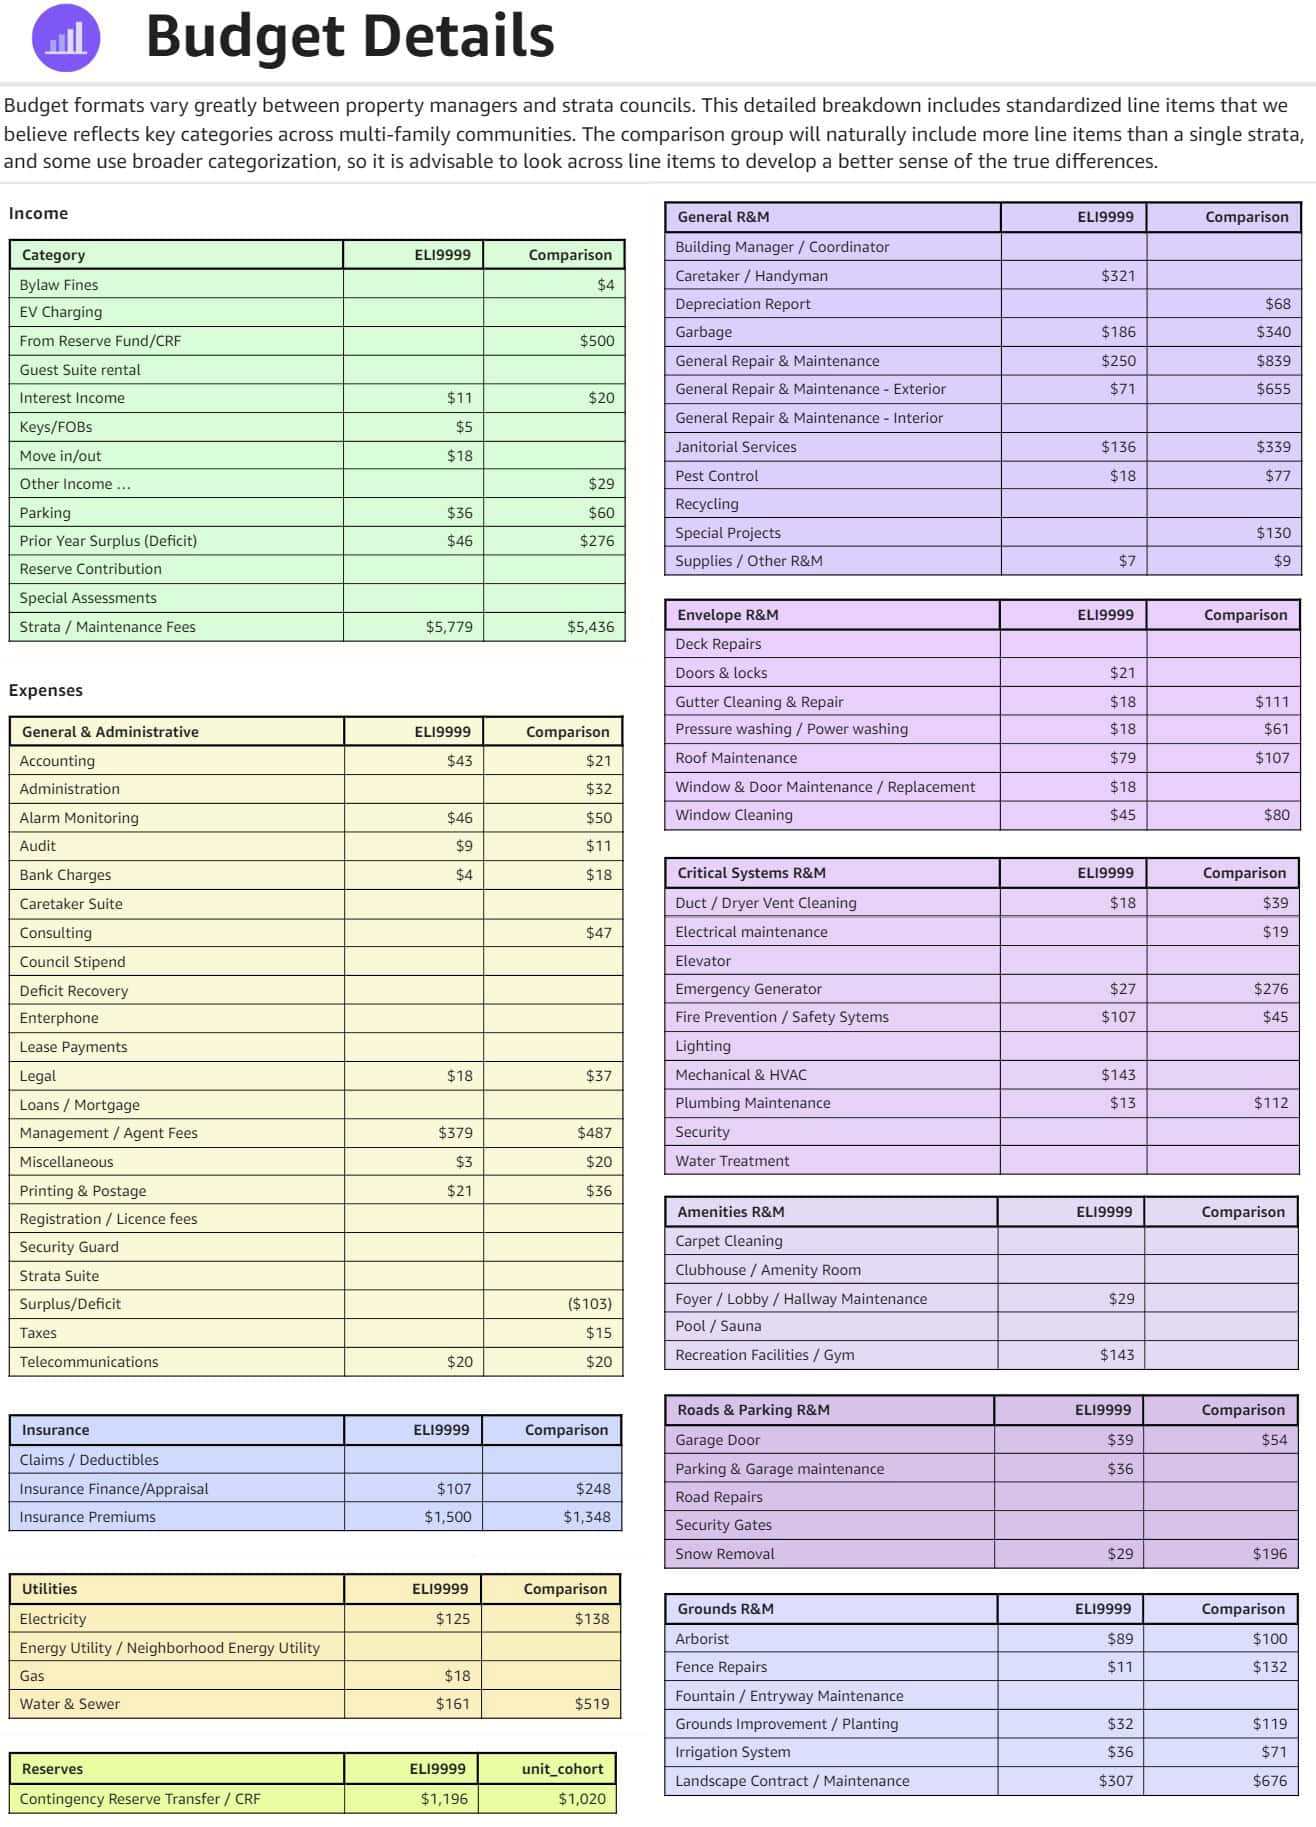
Budget Details
This is the ‘deep dive’ into individual line items on budgets. While data is powerful, and the stratas have similar attributes, no two communities are identifcal. Each will have their own unique aspects and have their own priorities, so being identical to others is not the objective.
In this graphic, the values are presented as $/unit, and for the comparison group they are based on the average value if that line item is present. Given that each strata council and property manager uses slightly different terminology we have matched them as best we could to our standardized list of approximately 100 income and expense categories. Also, each strata council and property manager breaks down their line items with varying granularity, with some allocating more to General Repair & Maintenance items while others are more detailed. As a result, you need to consider items across line items and sub-categories wholistically.
Consider those items that others have that your strata does not, and vice versa. Also take note of where there are significant disparities. This section enables critical review which you can calibrate based on the specific attributes of your community.
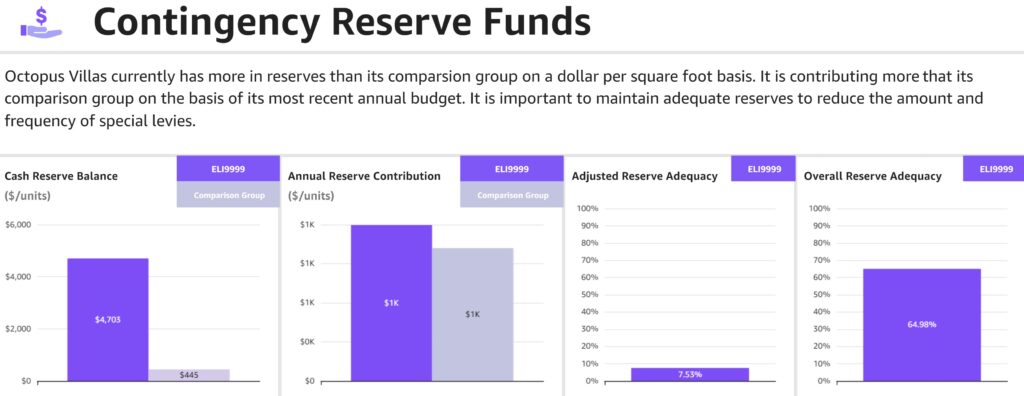
Contingency Reserve Funds
This section has four elements; the first two are comparative and the latter two are standalone. Your strata is shown in dark purple, and the comparison group average is grey.
Cash Reserve Balance is the amount in the Contingency Reserve Fund (‘CRF’) in dollars divided by the number of units. Higher is better, though this measure does not consider whether you have recently completed capital projects, or have projects upcoming.
Annual Reserve Contribution is the current year budget amount in dollars divided by the number of units. Higher is better, especially if your CRF balance is lower than the average, as it indicates your strata is putting more aside.
Adjusted Reserve Adequacy is the current CRF balance divided by the present value of all future capital expenditures from the latest available depreciation report, discounted at the assumed interest rate, and scaled up to 30 years. No credit is given for future CRF contributions under this methodology.
Overall Reserve Adequacy considers future CRF contributions (based on the current budget contribution, which is assumed to grow at the same interest rate as future capital expenditures are discounted) and is, in the view of Eli Report, a better measure of how well funded a strata is for the next 30 years.
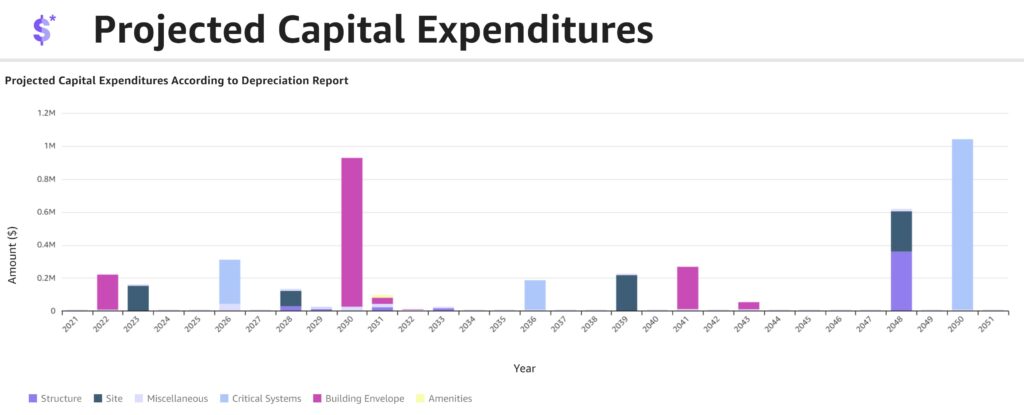
Projected Capital Expenditures
This section is a presentation of the data in the latest depreciation report, broken down across a handful of standardized sub-categories. Note the years at which there are major expected expenditures, which will be presented in tabular format in the following section.
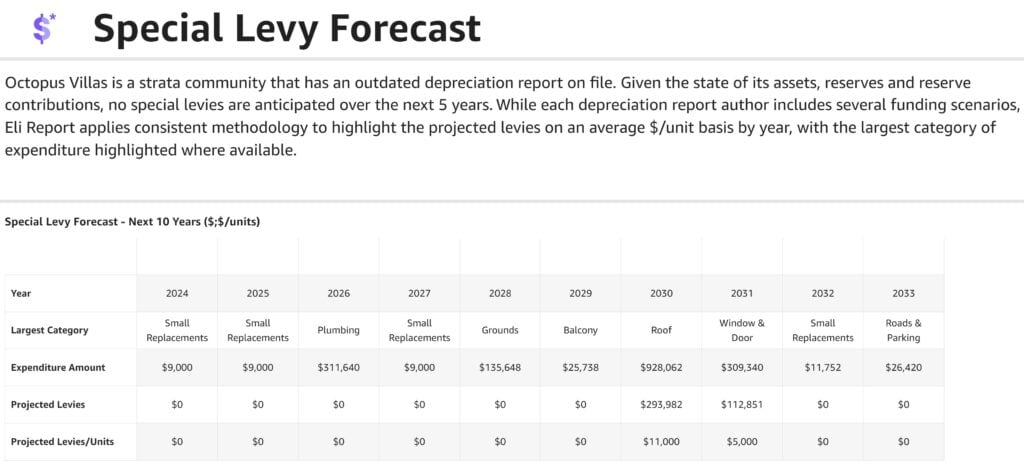
Special Levy Forecast
Using a combination of the latest depreciation report, the latest CRF balance and the most recent annual budget CRF contributions, the Special Levy Forecast table sets out the timing of projects, the projected levies and the average per unit. This presentation assumes that the work projected in the depreciation report/reserve study has been completed according to the schedule contained within the report and does not make any allowances for work which may been deferred or which may need to be completed ahead of schedule. There are many important assumptions in this analysis which you can read about here.
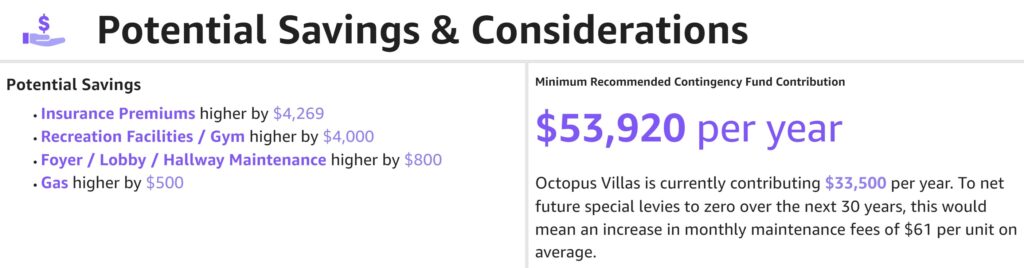
Potential Savings & Considerations
In this section, we identify areas where we believe you might be able to cut costs or achieve potential savings. Some may be a matter of seeking competitive quotes, others may take time or investment to achieve savings, and yet others are deliberate choices made by your strata. This is where your specific knowledge is critical. Initially we have chosen to deliberately exclude envelope and critical systems maintenance, among other line items, from consideration in the potential savings section pending feedback.
The Minimum Recommended CRF Contribution is the amount in the current year, increased annually at the same rate as future capital expenditures are discounted, that would allow the strata to fund the estimated capital expenditures in the depreciation report without net special levies over the 30-year term. Special levies may still occur as a result of a timing mismatch between the contribution and the project or actual timing of repairs, because actual costs are higher than the engineers have predicted, or because projects must be undertaken sooner than engineers have planned. As projects tend to take longer and cost more, a strata that wishes to be well funded should consider this a ‘minimum’.
Conditions of Use
The conditions of use should be read carefully along with the Terms of Service and Privacy Statement.
While the team at Eli Report is not licensed to provide advice or answer specific questions about any strata, we care deeply and commit to review any data brought to our attention for accuracy. We can also respond to questions of a general nature that may help you interpret your Annual Benchmark Report.
Included free with your Annual Benchmark Report is an Eli Report with Special Levy Forecast ($60 value) which can be shared with all owners as a tool to keep them informed and to provide an objective view of key issues, upcoming levies, etc.